** The USDA September Crop Report is deemed as bearish as NASS adjusted their soybean and corn yields upwards. USDA pegged the September US corn yield at 169.0 BPA and soybeans at 49.9 BPA. Compared to August, the US corn yield was up .4 BPA with soybeans up .5 BPA. The marketplace initially reacted with black box selling, but unlike the August report, funds are already sitting on a sizeable net short position and a cascade of price is not expected. End users will see today’s weakness as buying opportunity.
ARC would not be making sales at current prices and we await actual harvest data to help determine if the September NASS yield estimates are correct? Our view has been that it’s the October report that will end the ongoing 2017 US corn and soybean yield debate.
** The NASS Sept US corn yield was pegged at 169.9 BPA with yield gains in; IL (+1 BPA to 189 BPA from August), SD (up 5 BPA to 145 BPA), ND (up 3 BPA to 124 BPA), and across the southern US. Record corn yields were posted in TN, NC, AL, GA and LA. US corn ears per acre increased to 28,700, but ear weights declined to .342 pounds. The chart on the next page reflects the gain in ear numbers, but fall in weight. ARC expects a further fall in ear weights as September is still the above both 2014 years.

2016/17 US corn end stocks were reduced to 2,350 Mil Bu with a 70 Mil Bu increase in exports and a 50 Mil Bu drop in food/seed and industrial use. 2018/19 US corn end stocks were raised by 62 Mil Bu to 2,335 Mil Bu via the larger US yield and 25 Mil Bu cut in US ethanol use to 5,475 Mil Bu. The average cash corn price was lowered to $3.20 for the crop year.
World 2017/18 corn end stocks were raised 2 MMTs via the larger US carryover and a 2 MMTs cut in world corn trade. Domestic corn feeding was also reduced 4 MMTs to 1,057 MMTs.
** The US 2017 September soybean yield was estimated at 49.9 BPA, up .5 BPA from August and down just 2.1 BPA from last year. US 2017 soybean production was estimated at a record large 4.43 Bil Bu, up 120 Mil Bu from last year. State yields showed an increase of 4 BPA in SD to 45 BPA, a 2 BPA gain in ND to 35 BPA, and a 1 BPA increase in IA to 57 BPA. IN and OH also posted 1.0 BPA yield gains to 56 and 54 BPA, respectfully. Limited soy yield changes were noted across the Delta and the Gulf States.
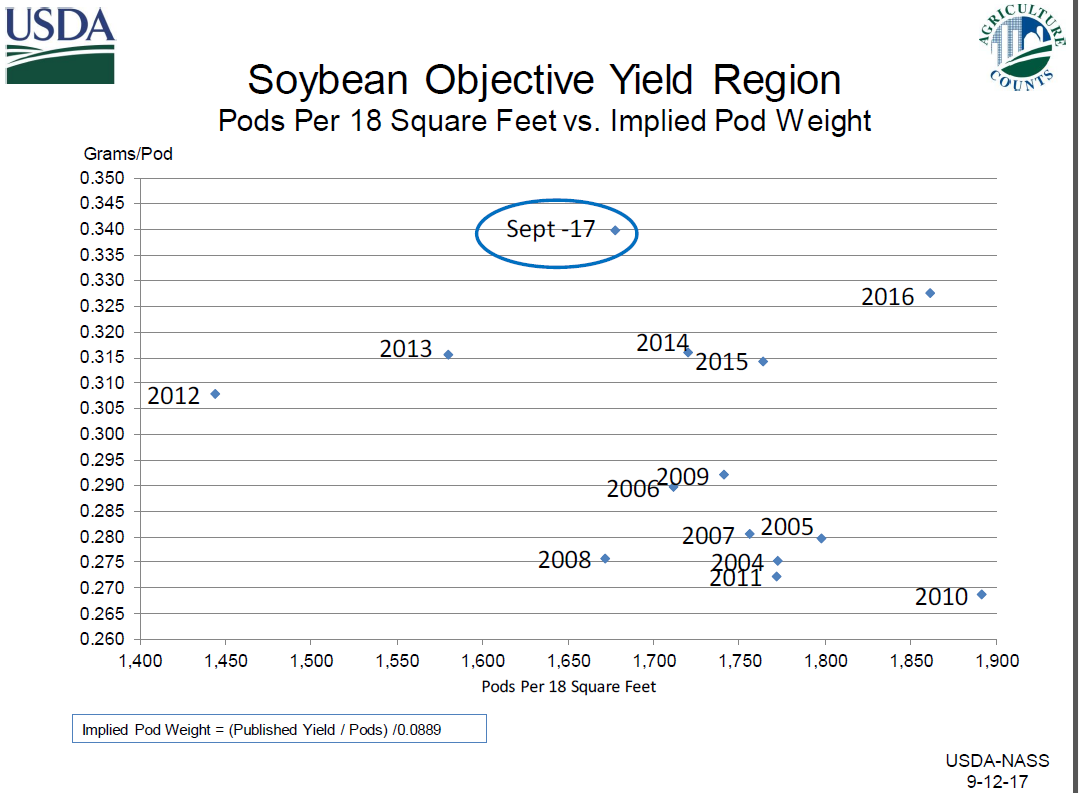
The chart below reflects that NASS is using a record large soybean pod weight of .34 grams. This is 1.5 grams above last year! Notice that US pod numbers are at their lowest level since 2008 – and if NASS is not right on its hefty pod weight, a steep downward yield correction could lie in the offing in October? Midwest soybean harvest yield results will be closely monitored in the weeks ahead. 2012 and 2013 are other years of poor pod counts with pod weights were adjusted down in ‘13. Our bet is that NASS is too high on US pod weights.
** US 2016/17 soybean end stocks were adjusted down to 345 Mil Bu via 20 Mil Bu increase in exports and a 5 Mil Bu boost in crush. 2017/18 US soybean end stocks were left unchanged at 475 Mil Bu with an increase in US 2017/18 exports to 2,250 Mil Bu while crush was held unchanged at 1,940 Mil Bu.
** US 2017/18 US soyoil end stocks were cut to 1,757 Mil Bu via a sharp upward reduction in biodiesel use to 7,000 Mil pounds via duties. Such stocks are tight and should offer support to spot soyoil below $.335.
** Finally, 2017/18 US wheat end stocks were left unchanged at 933 Mil Bu with WASDE increasing its Russian wheat crop estimate to 81 MMTs.