


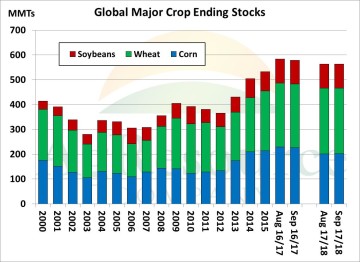
 NASS again surprised the trade with larger than expected corn & soybean yield forecasts. This of course is bearish, and the market is now left to wait on actual combine data to determine if NASS’s estimates are correct. Generally big crops get bigger in Oct and beyond, but no doubt the 2017/18 US growing season has been unique – and pod & ear weights are still overstated. Sep yield estimates are still heavily survey-weighted. Otherwise, the Sep report lacked excitement, and we mention that a very broad trend of reduced major crop stocks is intact without another season of near-perfect weather in South America this winter and next spring. For the first time in months, the USDA cut old crop combined global stocks, from 584 MMTs to 579. New crop combined stocks were lowered fractionally to 563 MMTs. Sustained rally efforts now require disappointing combine results in major producing states, but most likely an ongoing sideways trend prevails. The flow of actual yield data will tick upwards in the next 10 days, and keep in mind currency trends will be just as important as yield updates.
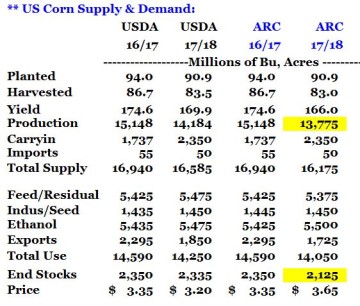 NASS again surprised the trade with a higher than expected US corn yield estimate (169.9 Bu/Acre, vs. 169.5 previously). Ears were found, ear weight was dropped, and overall only marginal changes were made on a by-state basis, and 1-2 Bu/Acre changes were most common. The US does look to have avoided a worst-case scenario, in which this summer’s heat and dryness would have pushed national yield to 164 or less, but we do expect the market to continue to debate yield within a range of 166-169 in the weeks ahead, and more important that today’s release will be actual results from the field. ARC maintains that NASS”s ear weight projection (.343#, tied for 4th highest on record) is still slightly overstated, but no doubt there’s a lot of corn in the US & South America. Unlike the Aug report, managed funds are estimated to be short a net 120,000 contracts, which is rather sizeable.
 The USDA raised new crop Argentine production 2 MMTS to 42 MMTs (which may be premature as seeding there is already delayed), but otherwise world numbers were left untouched. Given changes this AM to the US balance sheet, new crop major exporters’ stocks/use inched slightly higher, but the issue is still that the market simply isn’t moving up or down the stocks/price curve enough to engender a wildly bullish or bearish outlook from current prices. Rather, our work suggests that favorable crop establishment in South America must be confirmed before renewed selling emerges. In the near/medium term, it’s left to speculators (which again are already short) to drive prices much lower. Farmer selling will all but shut off through harvest following a flood of sales & deliveries in late August. End users should lock in forward supply coverage on a scale down basis. Patience is advised with respect to new sales.
 In the old crop balance sheet, crush was increased by 5 Mil Bu to 1,895 million, crush was raised 20 Mil Bu to 2,170 million. Those changes to demand lowered the old crop stocks forecast by 25 Mil Bu to 345 million. The big surprise in the report was a 0.5 BPA increase to the new crop yield estimate form NASS to 49.9 bushels. New crop exports were increased by 25 Mil Bu, to 2,250 Mil Bu.
At the bottom line, the smaller carry in and larger new crop export figure more than offset the larger yield. The new crop stocks forecast was unchanged from August at 475 Mil Bu, however, the season average price forecast range narrowed to $8.35-10.05, and the midpoint of the range was lowered by a dime to $9.20. November soybeans fell sharply at the report release, but quickly found support under $9.40, and spent the rest of the day recovering. At the close, November was back over $9.50.
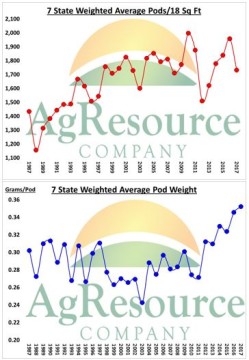 NASS raised their estimate of the US soybean yield by half a bushel from the August estimate to 49.9 BPA, which if realized would be the 2nd largest US soybean yield on record and the 4th consecutive year for an above trend national yield. Yields were raised in 13 states, lowered in 5 states, and unchanged in 9. Yields in IA, IN, OH were increased by 1 BPA each, while NE and MN yields were lowered by 2 BPA. Regionally, the largest increase in production was realized in the Delta states, where combined production was up 67 Mil Bu from August. W Cornbelt production was down 27 Mil Bu, and the E Cornbelt increased nearly 15 Mil Bu. The charts show the 7 state average pod count was the lowest since 2013, and the 2nd lowest since 2008. However, the big yield comes from NASS’s implied record large pod weight. Producers across the Cornbelt, who saw limited rains in August have been quick to argue against this assumption. We agree, and maintain a yield estimate of 47 BPA.
 Aside from crop yields, perhaps on of the most hotly debated topics in the soybean trade has been the outlook for exports. The 2016/17 projection has steadily increased in recent months on another year of better than expected late season demand. And with large available supplies, the USDA is penciling in an 80 Mil Bu increase for 2017/18 exports. Export commitments are well behind a year ago, but Chinese buyers have turned active on the late summer break. The chart plots the accuracy of the September WASDE export projection. Since 1990, the Sep estimate has been too low in 18 years (67%) and too high in 9 years (33%). More recently, the Sep estimate has been too low in 9 of the last 10 years. At this time, we see no reason to strongly disagree with the USDA’s export forecast, as we expect a strong shipment pace to develop into January, while exports in the last half of the year will largely determined by S American crop sizes.
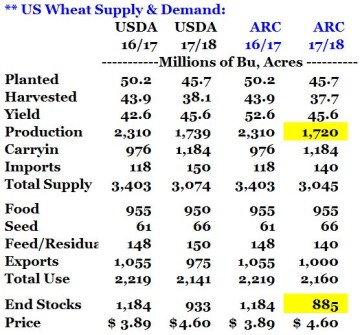 The US all wheat balance sheet, as expected, was left completely unchanged. NASS’s Small Grains Summary is due at the end of the month, and that report will feature final US wheat yield and acreage, and until those numbers are available, even spring wheat production won’t be adjusted. By class, the USDA did raise white wheat exports a sizeable 20 Mil Bu, and cut HRS & HRW exports 10 Mil each, offering some relief to high protein balance sheets. However, we fully expect NASS to reduce US wheat production 20-25 Mil Bu on Sep 30th, which along with better US export demand beyond the fall quarter will tighten US stocks modestly. The US Gulf market is still firmly positioned to capture world trade share from Europe and Australia in the second half of the marketing year, and despite large global stocks, a bearish outlook is not advised at current prices.
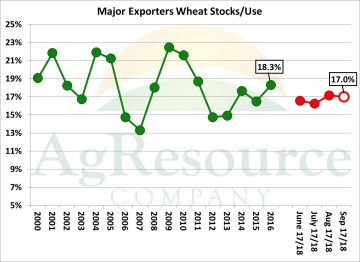 Russian wheat production was lifted 3.5 MMTs to a new record 81 MMTs. Yield data in Russia this week has turned negative, and so consensus now centers on a Russian crop of 81-84 MMTs. This is massive, but also a far cry from expectations of 90-92 MMT just weeks ago. EU production was lowered slightly, Australia’s crop was lowered 1 MMT. Old crop end stocks were reduced, and overall major exporters’ stocks/use tightened fractionally, and as a whole the major exporter wheat balance sheet will be just a bit tighter than it was a year ago. A bullish outlook requires a further collapse in the US dollar, or widespread weather issues in the Black Sea and Europe this winter/next spring, but like corn, funds are heavily short and even newer bearish info is needed to pull values lower. Note that the Russian fob market is firm at $185/MT, vs. $180 in late August.


