Bottom Line: Brazil exported 690,000 MT of corn last week. In comparison, Argentina’s exports were 297,000 MT. Brazil’s corn exports are down from the previous week but seven-fold what was exported in the same period last year. Brazil’s corn export “commitments” were estimated to be 30.28 MMT as of Dec 22. That’s up 143% from a year ago but is only the 2nd largest (for this week). Ship lineups indicate that 4.01 MMT may be shipped in December vs. last year’s shipments of 0.93 MMT and SECEX’s official December exports of 1.01 MMT. The pace of Brazil’s cumulative corn commitments suggest that annual exports could be 2.5-3.5 MMT below the USDA’s projection for a record 36 MMT.
+++++++++++++++++++++++++++++++++++++++++++++++++++++++++++++++++++++++++++++++++++++
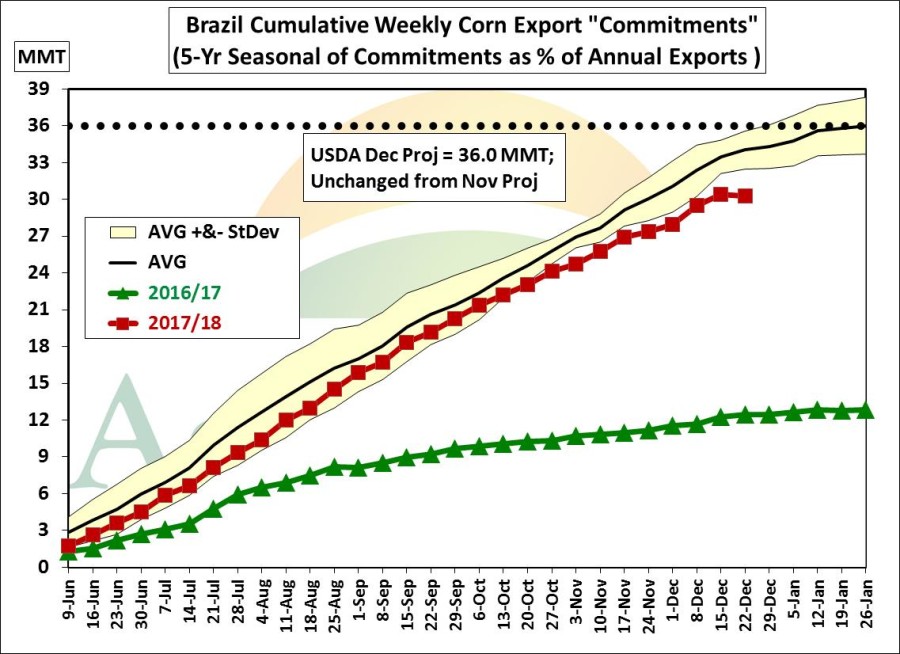
On Dec 12, USDA left its projection for Brazil’s corn exports unchanged at a record 36 MMT. For the week Dec 16- Dec 22, Brazil exported 690,000 MT of corn vs 792,000 MMT in the previous week and well above the 97,000 MT a year ago. In addition, Brazil’s corn export “commitments” (shipments to date, vessels loading or waiting, and vessels to arrive) were estimated to be 30.28 MMT. That is 127,000 MT LESS than the previous week and it is 4.25 MMT BELOW the previous record commitments for this week set in 2015 (see chart below). Commitments have accounted for 84.1% of the USDA’s projection for annual exports. On average, commitments as of this date account for 94.5% of annual exports.

This week, the tonnage of vessels that were waiting (or scheduled to arrive) was 2.53 MMT (see chart below), down from the previous week. The lineup peaked four months ago but the decline in the lineup has been gradual since there is still have another 5.71 MMT of expected export demand that has not yet appeared in the lineup.

The chart below shows that corn export commitments are now nearly two standard deviation below the 5-year average pace needed to meet the USDA export projection of 36.0 MMT.
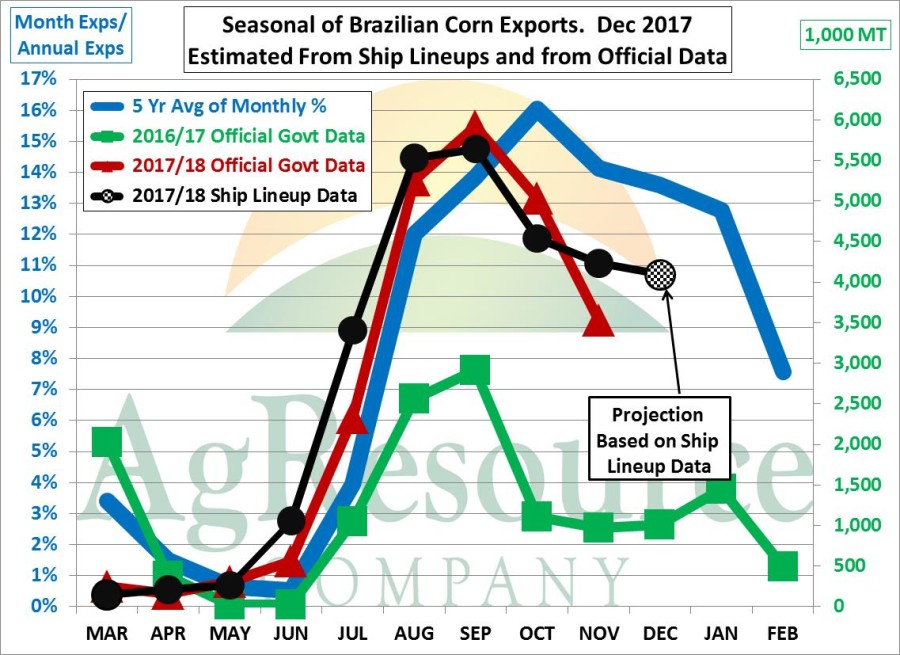
The chart below shows the monthly seasonal of Brazil corn exports. The black circles represent monthly shipments based on shipping data. The red triangles represent official SECEX monthly exports. The green squares are last year’s SECEX monthly exports.
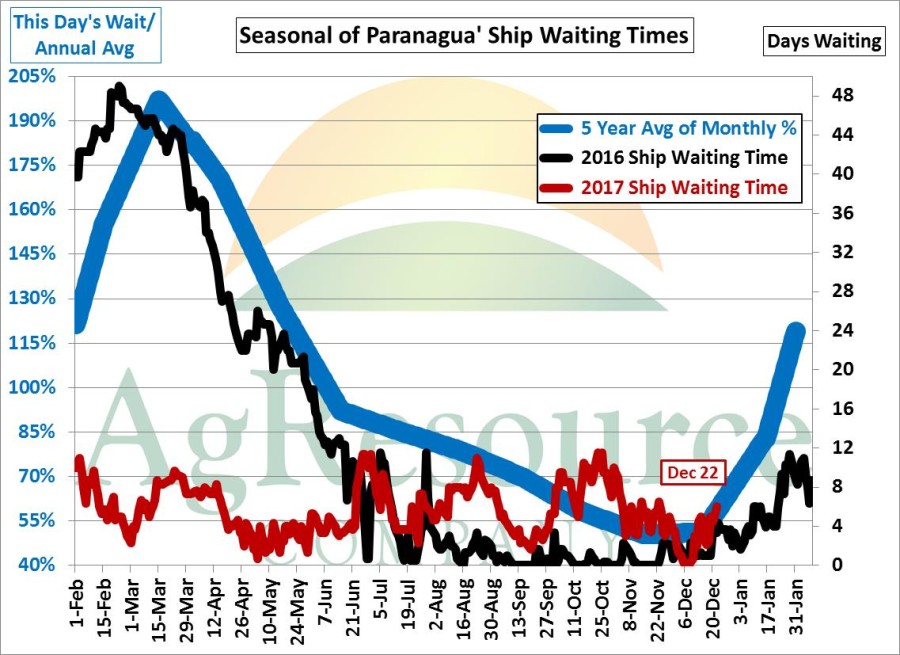
As of Dec 22, ship waiting times at the three public sheds at Paranagua was estimated to be 6 days (see red line read off right axis in the chart below). That’s up 1 day from the previous week and more than a year ago when the waiting time was 4 days (see black line).