


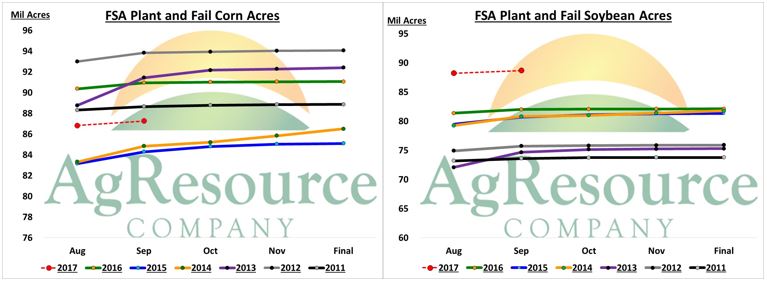
 The FSA’s monthly update of certified acres was released on Tuesday. The FSA reported that there was 87.26 million corn acres, an increase from the August update of 426,074 acres, and there was 447,348 more soybean acres for a total of 88.67 million. The 2 charts show the monthly history of the FSA count of acreage enrollment since 2011, when monthly reporting began. Generally, crop acreage has to be certified by July 15th, and acres certified after the date are subject to a late fee. Late certification also requires a field visit by the local FSA office, and the acreage can not be certified until the late fee has been paid. On average, by the September data release, 99% of all corn and soybean acres have been certified.
 While the FSA’s publicly reports monthly data, NASS receives a weekly update on acreage certification from the FSA office. This data, along with NASS’s survey data and remote sensing data at specific times during the growing season are used to make changes if necessary, to corn and soybean acreage estimates in the October crop report. Thus, the trade closely follows each update from the FSA. The charts below plots the relationship between certified acres in September, and NASS’s estimate of crop planted acres in October. There are just 6 years of monthly data available from the FSA, but Tuesday’s update suggests that both corn and soybean acres could increase in October.
 Prior to 2003, harvested area rarely changed in the October crop report. But since NASS began incorporating the FSA and other data into it’s estimates, acreage changes have occurred regularly, but are usually minimal. In corn, acres have increased in 4 years, declined in 7 years, and been unchanged in 2 years. Soybean acreage has declined in 9 years, been higher in just 4, and unchanged in 1 year (2016). There has been some rather significant surprises. In 2008, NASS put out a revision to the initial October report, that increased soybean acres by 2.2 million acres. And in 2013, corn acres were slashed by 2.5 million acres. But on average, both corn acres have changed by +/- 0.6%, which this year would be equal to 551,000 acres. Since 2003, soybean acres have changed by an average of +/- 0.8%, which would be 727,000 acres this year.


