

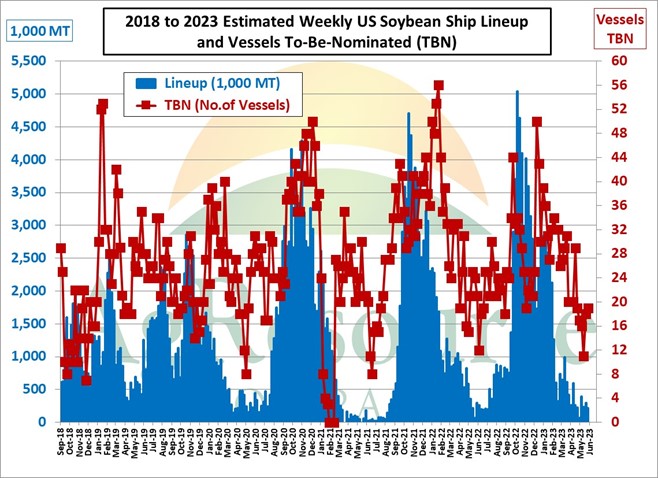
Summary: This week’s soybean export inspections could be 385,000 MT (14 MBU). That would be up 61% from the previous week. This week’s US soybean ship lineup is 220,000 MT (8 MBU), down 25% from the previous week. There were 19 vessels to-be-nominated (TBN), up 1 from the previous week. USDA left their projection for 2022/23 US exports unchanged at 2,015 MBU. Last year’s exports were 2,158 MBU. ARC projects 2022/23 final exports will be 1,960 MBU.
+++++++++++++++++++++++++++++
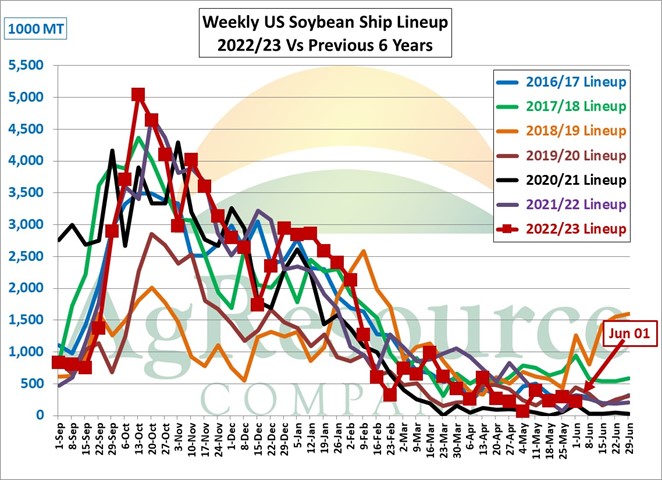
As of Jun 01, there were 220,000 MT identified in the US vessel lineup that were scheduled to load soybeans (see blue columns in the chart below). That is down 25% from the previous week. A year ago the lineup was 299,000 MT. The US soybean lineup is expected to remain low based on seasonal factors associated with the increased availability of Brazilian soybeans.
The chart below plots the 2021/22 ship lineup vs the last six years.
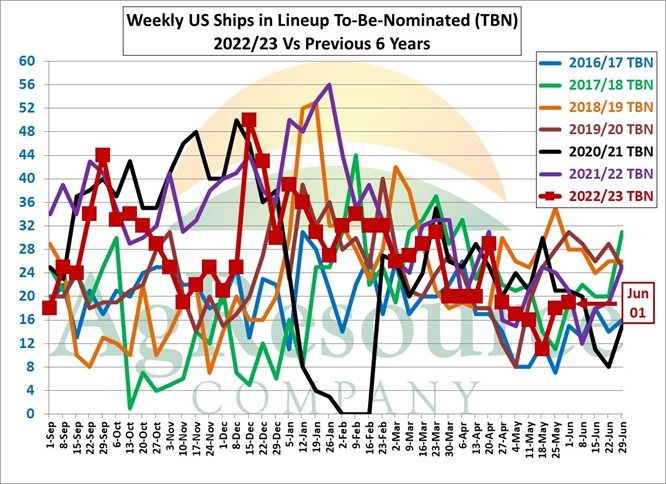
The chart below plots the number of vessels that were TBN vs the last six years. There were 19 ships in the lineup for which there was no tonnage, destination, or commodity cargo noted (TBN), up 1 from the previous week. A year ago, there were 25 vessels TBN. The greater the number of vessels that are listed as “TBN”, the greater the difficulty in estimating the export lineup for soybeans.
We can document 300,000 MT of soybeans were shipped last week. We can account for the cargo and destination of all but 4 vessels that were in last week’s lineup but not in this week’s. Therefore, we have added 165,000 MT to set the upper end of the range at 465,000 MT. We expect “actual” inspections to be near the midpoint of the range or about 385,000 MT. That would be up 61% from the previous week. A year ago, inspections were 365,000 MT.
This past week there was 1 vessel that we could identify that departed for China. We can identify 1 vessel in the lineup that is destined for China. There may be other vessels that departed or are destined for China which are listed as unknown.
Based on official export data and ship lineups, G-3 “cumulative” Oct-May soybean exports to China are estimated to be a record 73.8 MMT, up 8.8 MMT (13.7%) from a year ago. The previous record Oct-Apr G-3 exports to China was 69.4 MMT in 2021/22. In the May WASDE, the USDA raised their projection of China’s 2022/23 soybean imports 2 MMT to 98 MMT, up 7% from last year’s 91.6 MMT. Ship lineups indicate that G-3 June shipments to China could be at least 9.5 MMT.


