


 On Friday, NASS released it’s annual Farms and Land in Farms report. The data is collected in during the June Agriculture Survey, and NASS defines a farm as “any place from which $1,000 or more of agriculture products were produced and sold, or normally would have been sold during the year”. Additionally, acreage enrolled in CRP or WRP are included.
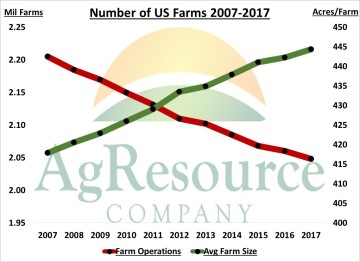
2005 is generally considered to have been the start of the “biofuel era”, while the impact on farm gate commodity prices began to emerge in 2007/08. But in spite of higher commodity prices, the chart shows a fairly consistent trend of consolidation that has developed across agriculture over the last decade. An aging population, along with high operating costs has led to fewer farms, with increasing average acres. NASS counted 2.05 million farms in the 2017 survey, down 12,000 from 2016, but a decline of 156,950 (7%) from 2007. The average farm size was 444 acres 2 acres more than in 2016, and 26 acres (6%) larger than a decade ago.
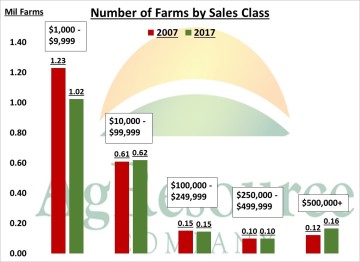 In addition to surveying the number of farms and size of farms, NASS reports data by sales class, which includes sales of agriculture products and government payments. The survey that took place in June of 2017, asks respondents to report the value of sales for the calendar year of 2016. Sales class breaks are at $10,000, $100,000, $250,000, $500,000, and $1,000,000.
By the numbers, nearly 50% of all farms realized farm revenue of less than $10,000, but compared to a decade ago, this was the segment of agriculture that had declined the most. Compared to 2007, there were 206,550 fewer (-17%) small farms. There were 2% more farms with revenue of $10-99,000, while there was 3% fewer farms with revenue of $100-249,000. The most significant increase over the last decade has been in the number of farms generating $500,000 or more. In 2007, there were just over 120,000 farms in that class, and in 2017 there were nearly 165,000 – a 37% increase!
 In addition to NASS’s Farms and Farmland report, the Chicago Federal Reserve released their quarterly Ag Letter. The report includes an update on the 7th District (IL, IN, IA, and WI) farmland values, as well as updates on current farm credit conditions. The report is based on a survey of agriculture banks across the district, and showed values for good farmland in the 4th quarter were on average up 1% year over year, marking the 1st increase since 2013. Versus the 4th quarter of 2016, the largest increase in farmland was in IA, which was up 3%, while farmland in IN and WI increased 2% each. IL was the only state that was lower, with a 1% decline. 75% of agriculture bankers reported that they expected farmland values to remain stable through the first quarter of 2018, as inventory remained tight, while both farmers and investors were showing interest in securing farmland.


