


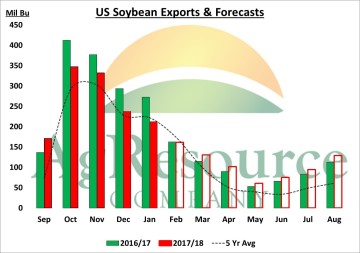
 The March US Trade Report was released Wednesday morning, and showed a US soybean export total near 212 Mil Bu. That figure was in line with the weak trend of the previous 3 months, and 61 Mil Bu less than a year ago. The total was 6 Mil Bu more than what had been reported last month by the USDA’s FGIS.
The current pace of both US soybean exports/sales continues to suggest that the USDA’s February export forecast is too high. ARC’s own estimate is 50 Mil Bu under the USDA at 2,050 Mil Bu, and the chart reflects monthly estimates needed to reach that annual total. Monthly FGIS data has already shown a 24% decline in February exports, which puts the monthly total close to last year. Note that US exports beyond February need to be above last year through August. This seemed quite optimistic several months ago, but the US has picked up significant export business in the last month. US soybeans today are offered nearly $.20/bu under Brazil thru May. And Argentine soybean exports are likely to fall 3-5 MMTs if private crop estimates of 40-43 MMTs are realized. US soybean exports will start to counter seasonally rise in April.
 Official US corn exports in January totaled 151 Mil Bu, a bit less than expected given weekly FGIS inspections. Using FGIS data for February, ARC pegs official US corn exports at 170 Mil Bu. The pace thus far remains well below last year, with cumulative Sep-Feb exports pegged at 811 Mil Bu, vs. 1,085 Mil a year ago (down 25%), but a sizeable boost in physical shipments of corn lies ahead. Outstanding export sales as of Feb 22nd rest at 848 Mil Bu, up 11% and record large. Note that Jan-Feb export sales, too, have been record large.
The boost in export demand has rallied spot Gulf basis to levels near parity with Argentina, and also Black Sea feed wheat’s premium to Gulf corn has been cut in half to just $9/MT. Still, we look for the USDA to raise US corn exports 50 Mil Bu in Thursday’s WASDE, and likely raises US exports 100 Mil Bu in total in coming reports. US corn exports in 2018/19 are forecast at/above 2,100 Mil Bu which makes yield and seeding important data points.
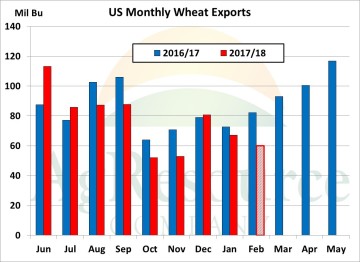 Census US wheat exports in January were a disappointing 67 Mil Bu, vs. 81 Mil in December, and 73 Mil in January of 2017. Using weekly FGIS data, ARC projects Feb exports at just 60 Mil Bu, down 20 Mil Bu from the previous year. The decline in physical wheat shipments bucks seasonal trends, and of course wheat’s rally is not at all being driven by demand. In fact, unlike corn, outstanding US wheat export sales are down 30% from last year (172 Mil Bu) and are the lowest since 2009/10.
Pace analysis suggests the USDA’s 17/18 US wheat export forecast (950 Mil Bu) is valid, but should the pace of sales remain between 7-12 Mil Bu per week into April, a downward revision is probable. ARC’s concern is that the drought-driven rally is limiting export demand to the extent that consumption loss will completely offset yield loss. Russian sales are supplanting US wheat exports.


