


 The USDA offered their best guess at US planted acreage estimates for 2018 today, at the annual Agriculture Outlook Forum. Combined seedings of the 4 principle crops: corn, soybeans, wheat, and cotton were estimated at 239.8 Mil acres, or 900,000 acres more from 2017. Corn and soybean acreage were each estimated at 90 Mil acres each, or 200,000 acres lower on corn and down 100,000 acres for soybeans. Wheat acres were estimated 500,000 more than a year ago at 46.5 Mil acres, while the most significant change was a 5% increase in cotton acres to a 7 year high of 13.3 Mil acres.
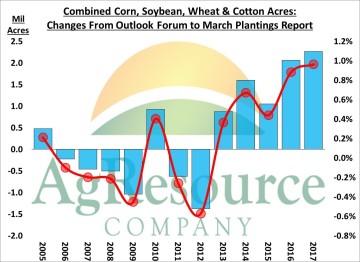
The chart plots the historical changes in the 4 acreage from the Outlook Forum to the March Prospective Plantings report. The Forum began incorporating cotton in 2005, which greatly improved the accuracy of their total crop forecast. It’s worth noting that in the last 5 years, the Outlook Forum 4 crop acreage estimate has been below the survey based March Prospective Plantings report. But on average, the Forum estimate has been within 1 Mil acres or 0.4% of the March acreage report.
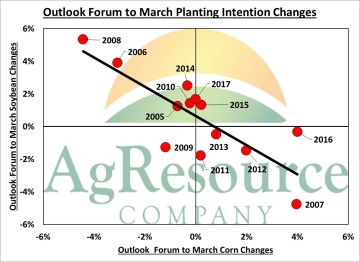 While the USDA has done a fairly decent job estimating total acreage of the 4 principle crops, (relative to the March Prospective Plantings report), there is increased variability of the distribution of acres. The biggest changes tend to occur in corn and soybeans. In the last 13 years, corn acres have on average been within 1.5 Mil acres of the Forum. In 6 years acreage was larger by an average of 1.7 Mil acres, in 6 years they were lower by an average of 1.4 Mil acres, and in 2017 acreage was unchanged. The chart shows that changes in corn and soybean acres are closely related, with soybean changes being nearly inversely related to corn. There was only 1 year (2009) in which both corn and soybean acres both declined, and just 1 year (2015) when corn and soybean acres both increased. A year ago, March corn acres were equal to the Forum estimate, while soybean acres were 1.5 Mil acres larger.
 Compared to final US acreage totals, the Outlook Forum estimates are less accurate than the March Prospective Plantings report. What farmers intend to do in March versus what they actually do is often influenced by a number of factors, including planting season weather and fluctuations in market price. In the last 13 years, the combined crop acreage totals have been larger in 5 years by an average of 3.3 Mil acres, and smaller in 8 years by an average of 1.8 Mil acres. In 2017, final acres were 3.4 Mil acres larger, due to more soybean and cotton acres. The average difference across all years has been 2.4 Mil acres. Again, the greatest changes have been realized in corn and soybeans, but the relationship between the 2 has been less precise than in the March report due to larger changes in wheat/cotton, which both tend to decline. Planting season weather in the upcoming weeks will ultimately determine how Central US acres be shuffled. But as the last few years have shown.


