

Summary: The evolving extreme cold developing across the U.S. and likely to last 7-10 days was not caused by any particular climate diagnostic. However, a look at solar activity offers a possible link. Solar activity is currently entering the 11-year minima about 1 year faster than forecast. The last solar minima which was unusually strong and of long duration produced cold to very cold mid-latitude winter seasons.
Discussion: The incoming arctic air temperature pattern will be extreme and of long duration as many locations from the Midwest to the Northeast Corridor are 15-25F below normal the next week (Fig. 1). Snow cover (Fig. 2) certainly helps the arctic air to maintain intensity. The polar vortex ensures a cross-polar flow of arctic air well into next week. There remains questions on whether the upper flow can tilt more westerly and become sufficiently vigorous to push milder Pacific air across the U.S. in the extended-range. Without a strong Pacific push the widening snow cover will resist any warm-up although the extreme cold should ease in 2 weeks.
Of interest is understanding the catalyst for this impressive long duration cold. The standard mechanisms including Kelvin Waves driven from the tropics pole ward and into the stratosphere or sunspot activity were not obvious contributors. However, one possible contributor is the general influence on polar climate by a faster than expected descent of solar activity into the next solar minima (Fig. 3).
We’re in a potential similar solar activity pattern to the 1800-1830 Dalton Minimum when global temperatures cooled due to an inactive sun stretched over 3 solar cycles. Evidence of this potential appeared about 10 years ago when the last solar minima lasted longer at stronger intensity than previously observed certainly within the past 100 years.
Further evidence that a Dalton Minimum-type solar signature was observed when the 2012-14 solar maxima was about half as strong as normal. Continuing the streak of evidence supporting this unusually long period of an inactive sun is the current solar activity which indicates we’re in the next minima about 1 year ahead of the NASA forecast.
Influence of solar activity on global climate is not well understood. Attributing the current cold wave to an inactive sun is a bit of a reach. However, let’s take a look at average winter conditions during the last 2-year solar minima to see if there’s anything we can learn.
The DEC/JAN/FEB meteorological winter 2008-09 and 2009-10 averaged colder than normal in the middle latitudes of the northern hemisphere including the U.S. and especially Russia (Fig. 4). The second of the 2 winter seasons was much colder (Fig. 5) which may be an implication for winter 2018-19.
Conclusion: The evolving extreme cold pattern affecting the U.S. and particularly high population zones of the Midwest and East U.S. was not clearly driven by any particular climate diagnostic. One possible contributor is the early entry of solar minima based on solar sunspot progression analysis. The solar minima appears to be developing about 1 year ahead of forecast. The last solar minima which was unusually intense and long-lasting occurred nearly 10 years ago and correlated to colder than normal winter in the middle latitudes of the northern hemisphere. The second winter of the 2 occurring within the solar minima nearly 10 years ago was the most extreme cold (of the 2). Whether solar activity is a direct contributor to the evolving cold which will be historic in comparison (once finished) is uncertain. However, the most recent analog does support the tendency for cold to very cold middle latitude winter seasons in the northern hemisphere most intense with the last winter of the solar minima episode.
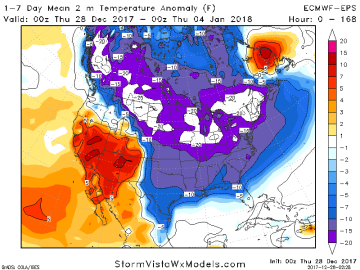
Fig. 1: Storm Vista WX Models depiction of the 7-day U.S. temperature anomaly forecast utilizing the European ensemble (model).
Fig. 2: U.S. snow cover has expanded across the northern U.S. (and advancing) helping to enhance the intensity of nearby generated arctic air.
Fig. 3: Solar cycle sunspot progression analysis this century and valid through November 2017 indicates the current activity has arrived at solar minima ahead of the NASA forecast (red line).

Fig. 4: The last unusually intense solar minima lasting for 2 winter seasons helped to produce cold meteorological winter in the U.S. and Russia plus Europe.
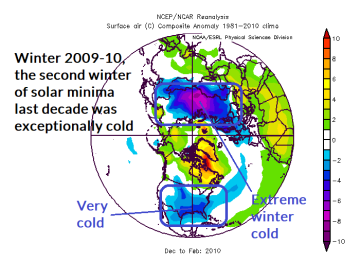
Fig. 5: The second winter of the solar minima occurring nearly 10 years ago was extremely cold in the middle latitudes.


