

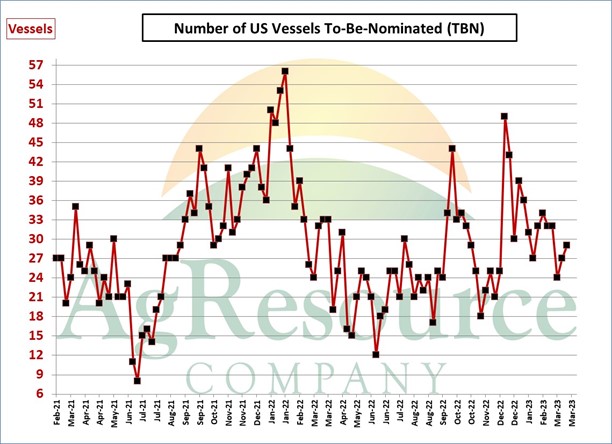
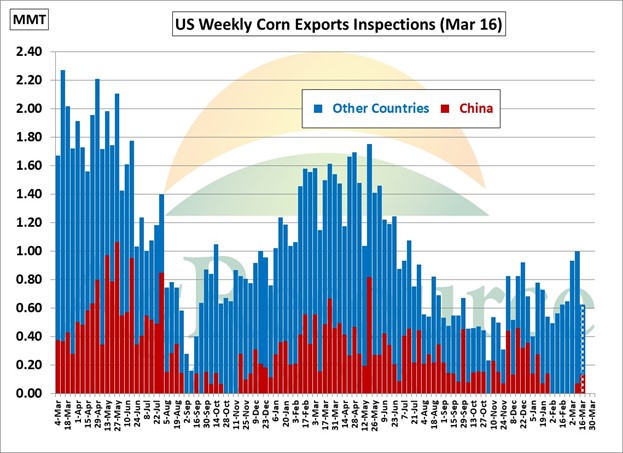
Summary: The lineup of ships waiting or scheduled to load US corn is estimated to 534,000 MT (21 MBU). That is down 32% from the previous week. Monday’s export inspections could be 1.22 MMT (48 MBU). That would be up 36% from the previous week and a 37-week high. There were 27 vessels to-be-nominated (TBN). That’s up 2 from the previous week. March Census exports could be 4.47 MMT, up from February’s 2.72 MMT. Sharply lower exports from Arg/Brz/Ukr (ABU) is expected to increase demand for US corn over the next 3-4 months.
+++++++++++++++++++++++++++++
As of Mar 16, there were 287,000 MT identified in the US vessel lineup that were scheduled to load corn. That is down 46% from the previous week (see chart below). A year ago, the lineup was 1.05 MMT.

There were 29 ships in the lineup for which there was no tonnage, destination, or commodity cargo noted (TBN). This is up 2 from the previous week. The more vessels that are listed as “TBN”, the more difficult it is to accurately estimate the export lineup for corn. A year ago, there were 32 vessels TBN.
We can document 500,000 MT of corn were shipped last week. We can account for the cargo and destinations for all but 3 of the vessels that were in last week’s lineup but not in this week’s. Therefore, we have added 50,000 MT to set the upper end of the range at 620,000 MT. However, we expect “actual” inspections to be well above the range or about 620,000 MT. A year ago, inspections were 1.50 MMT. There were 2 vessels (138,000 MT) that departed for China (see chart below). There are 4 vessels (140,000 MT) in the PNW lineup that are destined for China. There may be other vessels that departed or are destined for China which are listed as unknown.
The chart below illustrates the sharp drop in ABU corn exports that is projected over the next four months. Assuming that import demand does not decline signaficantly, this should boost US corn exports over the period.


